Visualizing Coverage Gaps
-
After completing the Visualizing Detection Coverage and Visualizing Adversary Techniques procedures within the same MITRE ATT&CK Navigator instance, click on the
+plus sign at the top of the page next to the existing layer name -
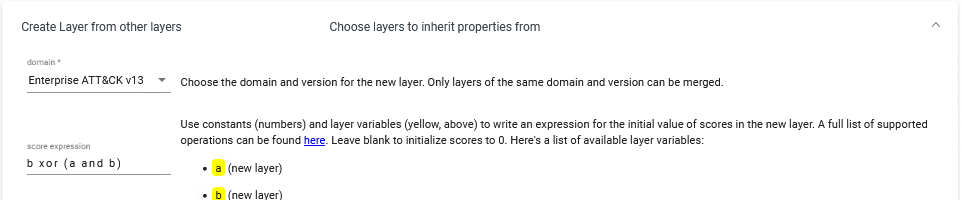
Click on Create Layer from other layers and input the following information:
- Domain:
Enterprise ATT&CK v## - Score Expression:
b xor (a and b)a= The layer created from Visualizing Detection Coverageb= The layer created from Visualizing Adversary Techniques
- Domain:
-
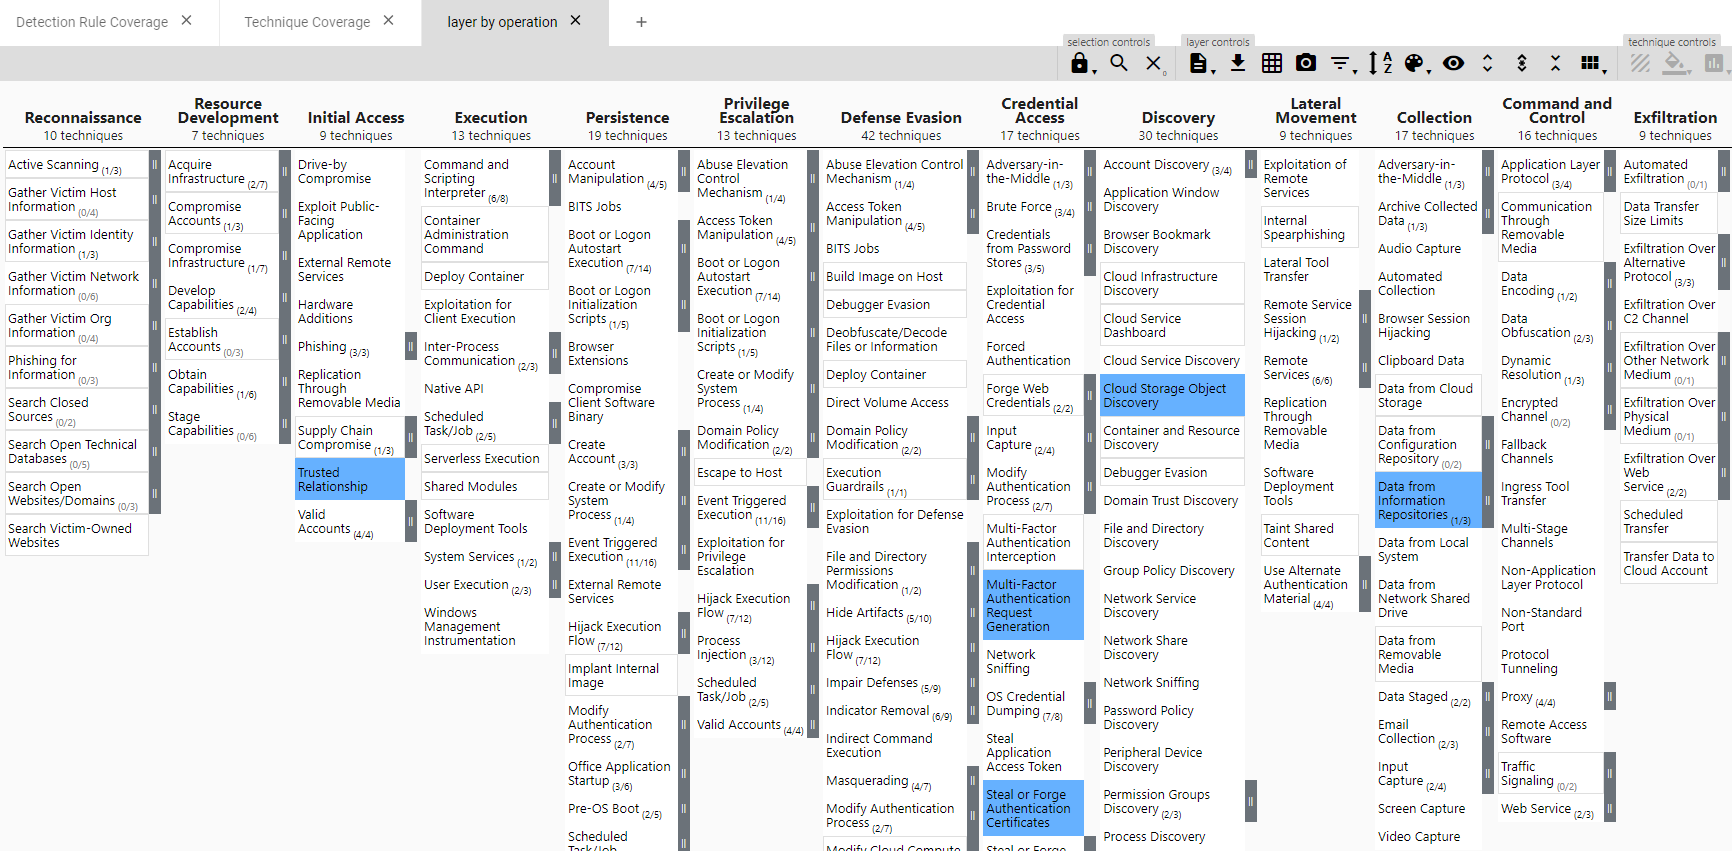
After clicking on Create, a new layer will be generated highlighting your detection blind-spots relative to the adversary’s techniques:
noteIn situations where there are no coverage gaps, the resulting layer will have all of the detection coverage techniques highlighted, but with a score of zero. This visualization is misleading so be sure to hover the cursor over a highlighted technique and check if the score is non-zero - if any highlighted technique has a score of zero, then they will all have a score of zero which ultimately means you have no coverage gaps.
-
You can now customize the layer visuals and render layer to SVG to export the layer as an SVG image file, if desired